4.5 – Phase Diagrams
4.5.0 – Learning Objectives
By the end of this section you should be able to:
- Understand what each line in a phase diagram represent.
- Understand what is in each region of a phase diagram.
- Understand what important points are on the phase diagram.
- Understand what the difference is between a vapour and gas.
4.5.1 – Introduction
Phase diagrams are used to show all the phases of a substance at different pressures and temperatures. Each line represents phase equilibrium or boundaries.
4.5.2 – Diagram
Shown bellow is a typical phase diagram.
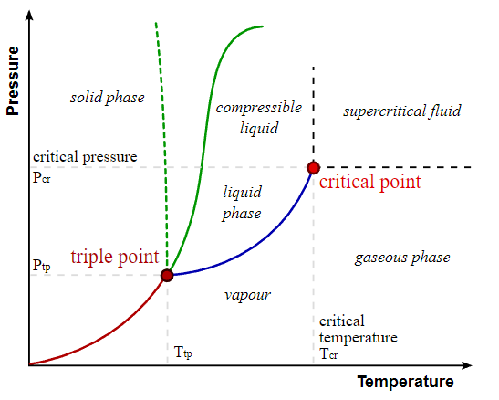
Attribution: [[::User:Matthieumarechal|Matthieumarechal]] [GFDL (http://www.gnu.org/copyleft/fdl.html) or CC-BY-SA-3.0 (http://creativecommons.org/licenses/by-sa/3.0/)], via Wikimedia Commons
The red line represents the boundary between a solid and a vapour. In this area, solid will directly turn to a vapour or a vapour will directly turn into a solid such as dry ice and \(CO_2\). The dotted green line represents the boundary between a liquid and a solid for polar fluids such as water. Since ice is less dense than liquid water, it causes the dotted line to skew to the left. The solid green line represents the same thing as the dotted green line except for non-polar fluids. Finally, the blue line represents the boundary between a liquid and a vapour.
Two main points of interest are the triple point and the critical point. The triple point is the point at which all three phases coexist at a certain pressure and temperature. The critical point is the point at which if you increase the pressure or temperature, a gas becomes indistinguishable from the liquid. The phase in this region is called a supercritical fluid.
Another example of a phase diagram is shown below. This is the phase diagram of water.
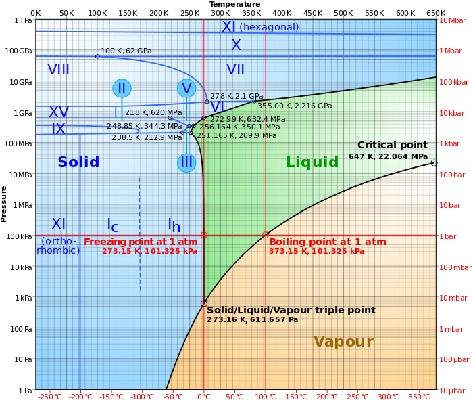
Attribution: By Cmglee (Own work) [CC BY-SA 3.0 (http://creativecommons.org/licenses/by-sa/3.0)], via Wikimedia Commons
4.5.3 – Difference Between Vapour and Gas
A substance is considered a gas when its temperature is higher than the critical temperature and below the critical pressure. A gas can not become a liquid by just increasing the pressure, you must also lower the temperature.
A substance is considered a vapour when its temperature is lower than the critical temperature and below the critical pressure. A vapour can become a liquid by just increasing the pressure.
4.5.4 – Phase diagrams for ternary systems
Partially miscible systems with 3 components can be represented in a ternary phase diagram. It’s actually shaped like an equililateral triangle:
In [ ]: